*** updated 31/01/2015 to include updated PDO vs. SoTR chart
In my last
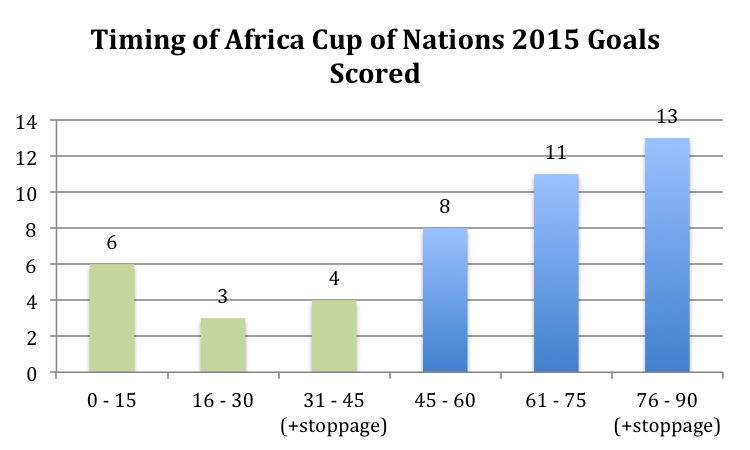
post I ran through some fairly general impressions of the 2015 Africa Cup
of Nations so far. Among other topics, I bemoaned the lack of goals and the
high number of draws. In this post I develop some analysis of the Africa Cup of
Nations by relying heavily on … wait for it … statistics.
By using data provided by whoscored.com
I set out to try and understand what aspects of a team’s game have helped them progress
to the quarter-finals. In short, I wanted to understand if it is more down to
skill or luck.
I also wanted to see if there is any way of guessing how the
quarter-finals will go based on trends or patterns in the data.
What I have found out is:
- It is a combination of skill and luck;
- 4 of the 8 quarter-finalists (50%) enjoyed over 50% of the possession in their group matches --> dominating possession is just as successful as...er, not dominating the possession. It would appear...;
- Only 3 of the 8 quarter-finalists (38%) took above the average number of shots per game --> shooting more than your opponent is not always a guarantee for success;
- Having a busy attack and quiet defence is no guarantee for progressing to the quarter-finals in this year's tournament; and,
- It is definitely NOT good defending keeping the number of goals down in this years tournament.
All of this begins with…
Dominance
One of the first topics I wanted to explore was the concept
of dominance. My reasoning is the most dominant team should surely win the
game, right?
In the first chart of many below, I compare the shots per
game a team takes and the shots per game it defends against. The x-axis
(horizontal) shows the number of shots the teams take per game. The y-axis (vertical) plots
the shots per game teams defend against. Broadly speaking my logic went like
this: “if you take more shots than your opponent, you dominate the game”. In
terms of statistics, comparing shots taken to shots defended, we have a simple
(but crude) measure of ‘game dominance’.
The dotted blue lines plot the ‘average’ (the same goes for all charts used) which is
roughly 11 shots for and 11 shots against per game. Using the example of
Senegal, they shoot above average against their opponents and they tend to face
fewer than average shots on their goal.
If you think about the chart as four quadrants, the ‘most
dominant’ quadrant is that one on the bottom-right. It is the area where teams
shoot the most and manage to stifle shots coming against them: in other words,
they are strong in attack and have a relatively quiet time defensively. The
top-right quadrant is the busiest quadrant. It is where teams have taken many
shots but also faced many shots. You get the picture.
So, in looking at this chart, we see that Senegal, Zambia
and Burkina Faso all belong to the bottom-right quadrant, but none of these
teams progressed to the quarter-finals.
This chart only shows whether the team has attacked its
opponents more or has been more on the back foot. It says little about the
effectiveness of the attack…
But you have got to
score to win
True. The Democratic Republic of Congo are the only team in
the quarter-finals to have scored fewer than 3 goals so far. Algeria have scored
the most of any team at the tournament so far. They also take the fewest number
of shots to score a goal:
Team
|
Goals
Scored
|
Shots
Taken
|
Shots
per goal
|
ALG
|
5
|
22
|
4.4
|
TUN
|
4
|
35
|
8.8
|
CON
|
4
|
33
|
8.3
|
GHA
|
4
|
38
|
9.5
|
EQG
|
3
|
27
|
9.0
|
MAL
|
3
|
28
|
9.3
|
CIV
|
3
|
30
|
10.0
|
GUI
|
3
|
22
|
7.3
|
RSA
|
3
|
33
|
11.0
|
SEN
|
3
|
44
|
14.7
|
DRC
|
2
|
37
|
18.5
|
ZAM
|
2
|
38
|
19.0
|
GAB
|
2
|
34
|
17.0
|
CAM
|
2
|
30
|
15.0
|
CPV
|
1
|
32
|
32.0
|
BFA
|
1
|
47
|
47.0
|
But it is not always so simple...
How many shots must a
player take, before he scores himself a goal?
The answer is not blowing in the wind, certainly not in
Equatorial Guinea. The chart below compares the shots a team takes to the
number of shots it takes the team to score. This is a crude measurement of
shooting skill, or the potency of the team’s attack. If a team takes more shots
to score a goal, generally speaking, they have less skill than a team that
takes fewer shots to score a goal.
The measurement in this graph is of ‘attacking
effectiveness’, i.e. how effective the attack of one team against the other.
Generally speaking, the teams in the bottom right of this chart are in the
sweet-spot. They take a lot of shots, so they play with a high intensity AND
they don’t take many shots to score a goal. It seems fairly reasonable then
that Ghana and Tunisia – two of the stronger teams in this tournament – are in
the sweet-spot. But, what about the other two favourites: Algeria and Ivory
Coast? Well, both Ivory Coast and Algeria don’t take as many shots as Tunisia
and Ghana but the four teams are similar in the aspect of not needing to take
many shots to score a goal. Interestingly, seven of the eight quarter-finalists
take below average number of shots to score a goal. In other words, generally
speaking the teams with highest attacking skill have progressed. The Democratic Republic of Congo is the exception: it has progressed to the quarter-finals taking an above average number of shots to score a goal.
What is a good
chance?
Alright, so shooting accuracy is one thing, but it is also
important for attackers to be supplied with plenty of chances by their
teammates. So, I was sitting there thinking (wahey): "how could I come up with a
stat simple enough to understand that shows a ‘good chance’ objectively?"
Most of us would agree that if a team advances play to a position where
they can shoot from inside the opponent’s box, they have created a good chance to
score. So, I developed a measure of what a good chance might be:
I have taken
the number of shots a team makes inside the box as a proportion of the total
shots they take (per game). So, if a team takes 8 shots inside the box per game
and takes 10 shots per game, its “good chance” proportion is 80%. Make sense?
In the chart below, the ‘sweet-spot’ is in the top
right-hand corner. Here, teams have a lot of possession and more than half of their
shots are inside the opponent’s box.
Senegal, Burkina Faso and Gabon all
populate this quadrant, however, none progressed to the quarter-finals. If we
look to the bottom-right quadrant, we see three quarter-finalists - Equatorial Guinea, Ghana and
Congo - populating the area. These teams create good chances (>50% of the shots they take are inside of the opponent's box) but have less than 50% of the possession.
 |
| Data sourced from whoscored.com graph idea my Charles Low (my own) |
So, then, it is not all about creating "good" chances...
The Importance of
Possession
My belief that possession is key to winning games (as well as scoring, obviously!) probably reveals my bias approaching the data,
so I should make it clear. My belief is based on seeing the way the tiki-taka
style popularised by Barcelona, (i.e. possession is king) has come to dominate
the game in recent years. When I think of “teams of my generation” very few
could compare to Barcelona under Pep Guardiola or the Spanish World Cup winners
of 2010.
I wanted to dwell on this thought for a little longer. Think
about it like this – how does a team convert its possession? Does it create a
high number of chances but has a weakness of conceding a lot of chances on the
counter-attack? Think Arsenal…
So, to try and translate this into figures I developed a "shot dominance ratio". I called it this way as I constructed a ratio of shots taken
by a team to the total number of shots in a game. So:
shot dominance = shots
for per game / (shots for per game + shots against per game).
If shot dominance
> 0.5 the team has taken more shots than its opponent.
Possession is the average possession figures over three
games. Again if possession is greater than 50% the team had more possession
than their opposition. So, the teams in the top-right of the chart (i.e. with
over 50% possession and 50% shot dominance) dominated the game in terms of
possession and shooting – broadly a measure for chances to score. Only five
teams – Democratic Republic of Congo, Cameroon, Ivory Coast, Burkina Faso and
Senegal – had more possession and shot more than their opponents. Three of
those teams are going home.
 |
| Data sourced from whoscored.com and graph idea Charles Low (my own) |
What about the defence?
Less is made of the defence, but it is interesting to look
at nonetheless. What this chart below reveals is really interesting. Remember
from my last post I said there have been a pretty low number of goals in these
games? Well, that is NOT explained by good defending. So, the explanation is
either excellent goal-keeping, or poor skill in front of goal – because it is
certainly not due to lack of chances being created.
Again, if we think about the chart as four quadrants, the
top-left quadrant is where good defensive teams are situated. It is the
quadrant where teams don’t allow many shots to be taken on their goal and it is
also where many shots must be taken before a goal is scored against them. If we
consider Equatorial Guinea way up there in the right-hand quadrant we could
view it that their defence has done well – it takes their opponents many shots
to score a goal. However, their defence (and goalkeeper) are probably well
over-worked as the team faces a lot of shots, on average, in games.
Something Else?
So, I sat there thinking (wahey): “how can it be that the
dominance of possession and shots cannot explain the team’s performances?” How
is it that teams who have more of the ball and shoot more than their opponents
do not qualify for the quarter-finals? It could be down to luck. But, it could
also be down to skill.
In football analytics there is a way of providing a
rule-of-thumb to quantifying skill and luck. Skill is described as the Shots On
Target Ratio (SOTR) [shots on target for/total shots on target]. Luck is
described as shooting % + saving %. It is taken as a given that it requires
great skill to shoot a high percentage on target. In the luck category, it is
considered a great fortune to save a high percentage of shots against you. [NB:
it makes sense right – you ever been watching a game and you thank god the
opposition striker couldn’t hit a barn door?!] I owe a great deal of praise to
Seth Dobson’s fantastic blog 2-2-6 for
explaining these concepts.
Basically, the higher the PDO, the greater the fortune a
team has. And, as luck is subject to laws of gravity this spells
bad news for teams with PDO of above 1000. In the graph the teams are grouped by colour according to where they finished in the groups. The quarter-finalists are the gold and silver marks. What we can see broadly is that 6 of the quarter-finalists have benefitted from luck - as PDO would have it - so far. How long will it last?
So, what have I learned? I have learned that making charts
is a great way to waste time and provides some insight into the beautiful game.
However, I still have a gut feeling Ghana are going to win this thing…